
This is an old revision of the document!
Table of Contents
Reports
The Reports option in the left navigation bar allows you to display data from the selected Project Diary in a grid format.
Data Content
Reports are organized into sections.
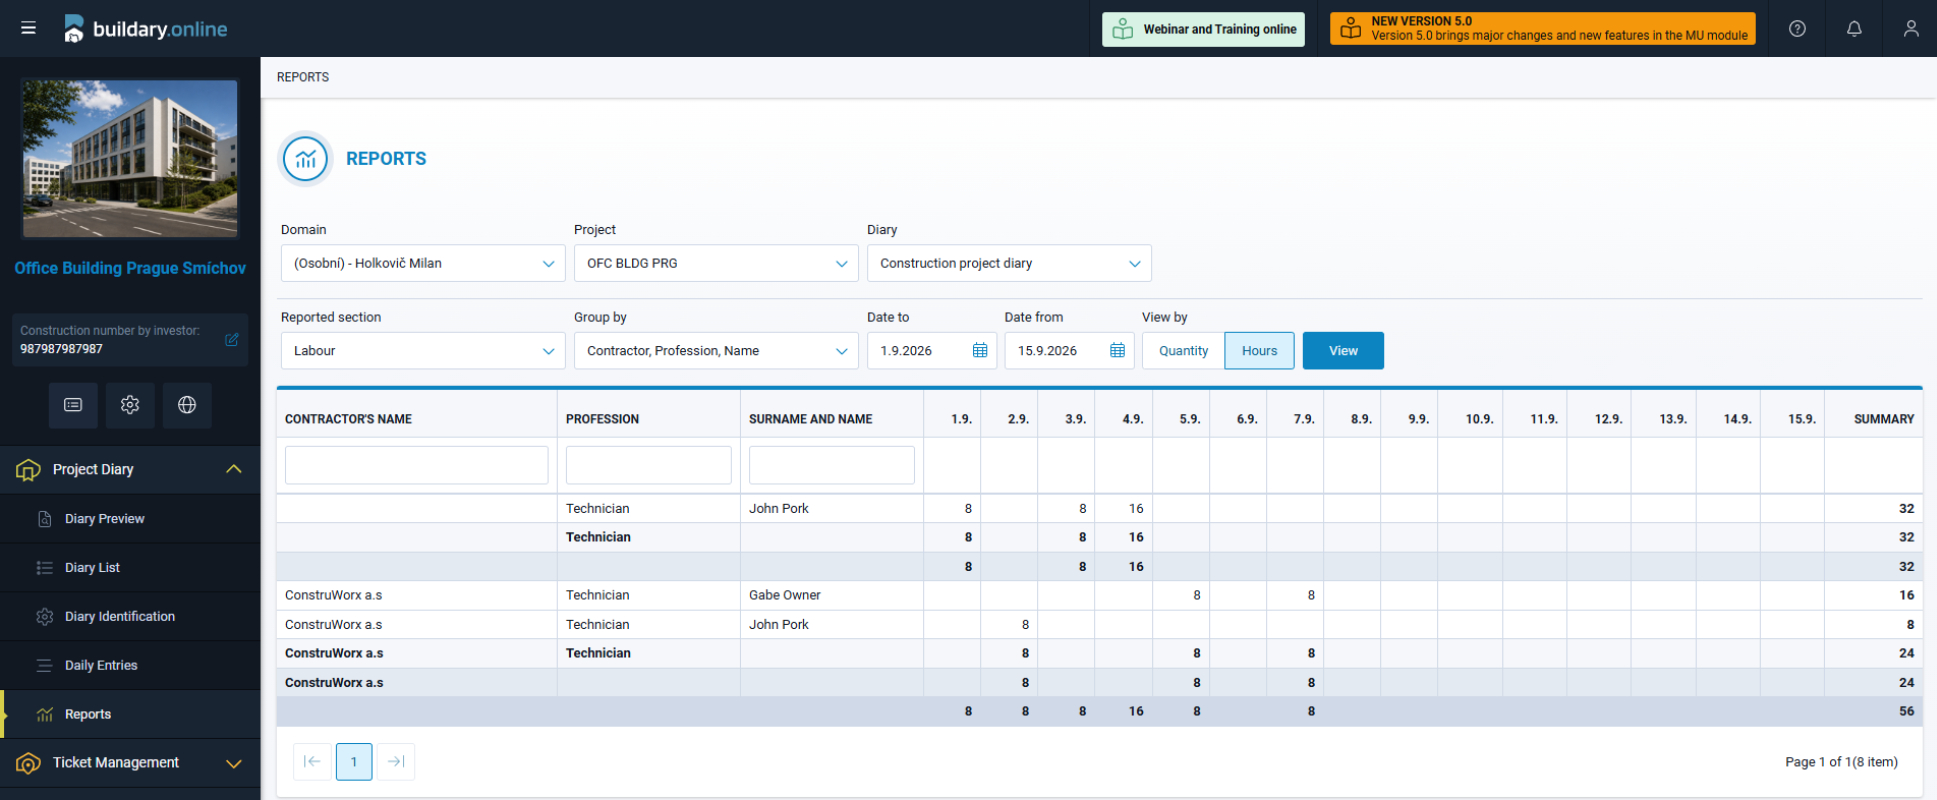
For each section, you can choose how the data should be grouped. The available grouping options vary slightly between sections depending on the data contained in each section.
For example, in the Labour section, there are 5 data grouping options. Grouping by Contractor provides the highest-level overview, while grouping by Contractor, Profession, Last Name and First Name provides the most detailed overview, including subtotals for each level, as shown in the image below.
What Is Displayed
Depending on the report section, the View by switch allows you to choose between displaying Hours (for Persons and Machinery), Quantity (for practically all sections), or Quantity of entries (for Materials and Works Performed).
For Labour, Quantity indicates the number of days on which a particular person was present on the project. In aggregated views, it indicates how many people were present on the project on a given day. Quantity does not take working hours into account, so each person is always counted as 1, regardless of whether they worked for one hour or the entire day.
Weather
The Weather section behaves differently from the other sections. Reports in this section are designed to identify instances where specific meteorological conditions occurred.
For example, if you want to find instances where the temperature was below 5°C, configure the settings as shown in the image below:
Period
Each report allows you to select the period for which you want to display data.
Depending on the selected period, the level of detail displayed in the columns is automatically determined according to the following rules:
- If the user selects a time period shorter than 32 days, the data in the columns will be displayed by day. Therefore, a maximum of one month can be displayed by day.
- If the user selects a time period from 32 days to 36 months, the data in the columns will be displayed by month. Therefore, a maximum of 3 years can be displayed by month.
- If the user selects a time period longer than 36 months, the data in the columns will be displayed by year.
Whenever you change any settings, you need to click the  button to load the correct data.