Dashboard
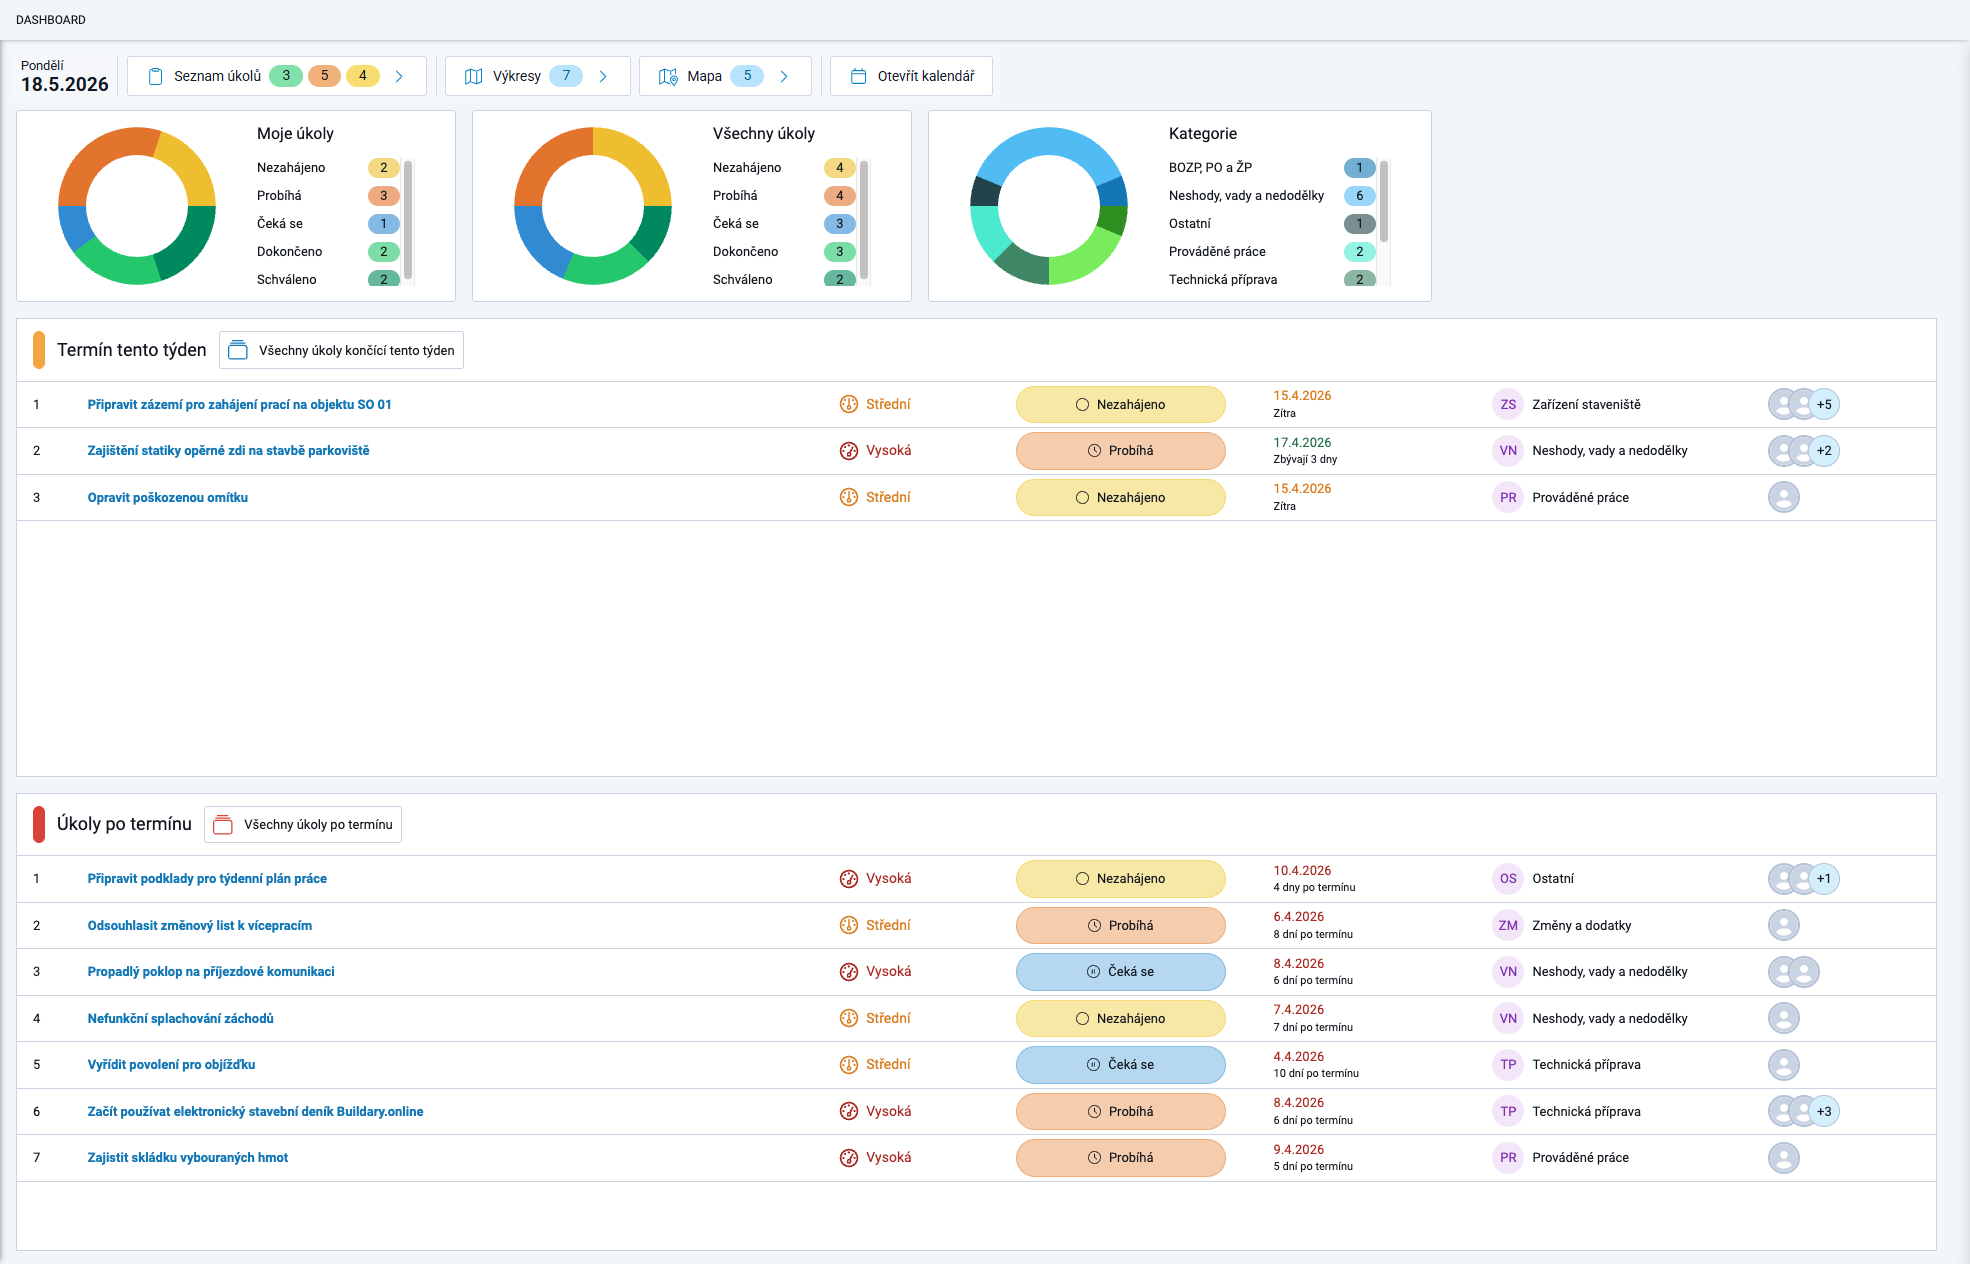
The Dashboard is an interactive task overview, serving both as a simple overview of tasks according to their individual phases and as a quick navigation hub.
Functionally and visually, it consists of three parts:
- the top row with the current date and navigation options
- task overview charts according to three different criteria
- two task lists organized by deadline
Each part is described in more detail below.
1/ Top Row - Date, Navigation, Calendar

The top row of the Dashboard window displays the current date and 4 buttons:
- Ticket List → the button displays the number of completed / in-progress / not-started tickets and opens the Ticket List page
- Drawings → the number indicates the number of tickets localized on drawings and opens the Drawings and Map page on the Drawings tab
- Map → the number indicates the number of tickets localized on the map and opens the Drawings and Map page on the Map tab
- Open Calendar →
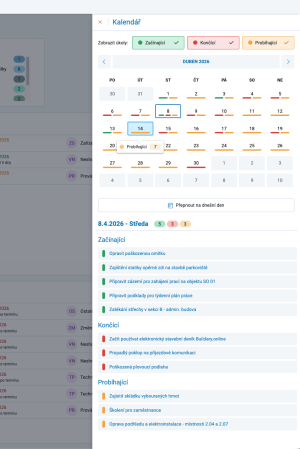
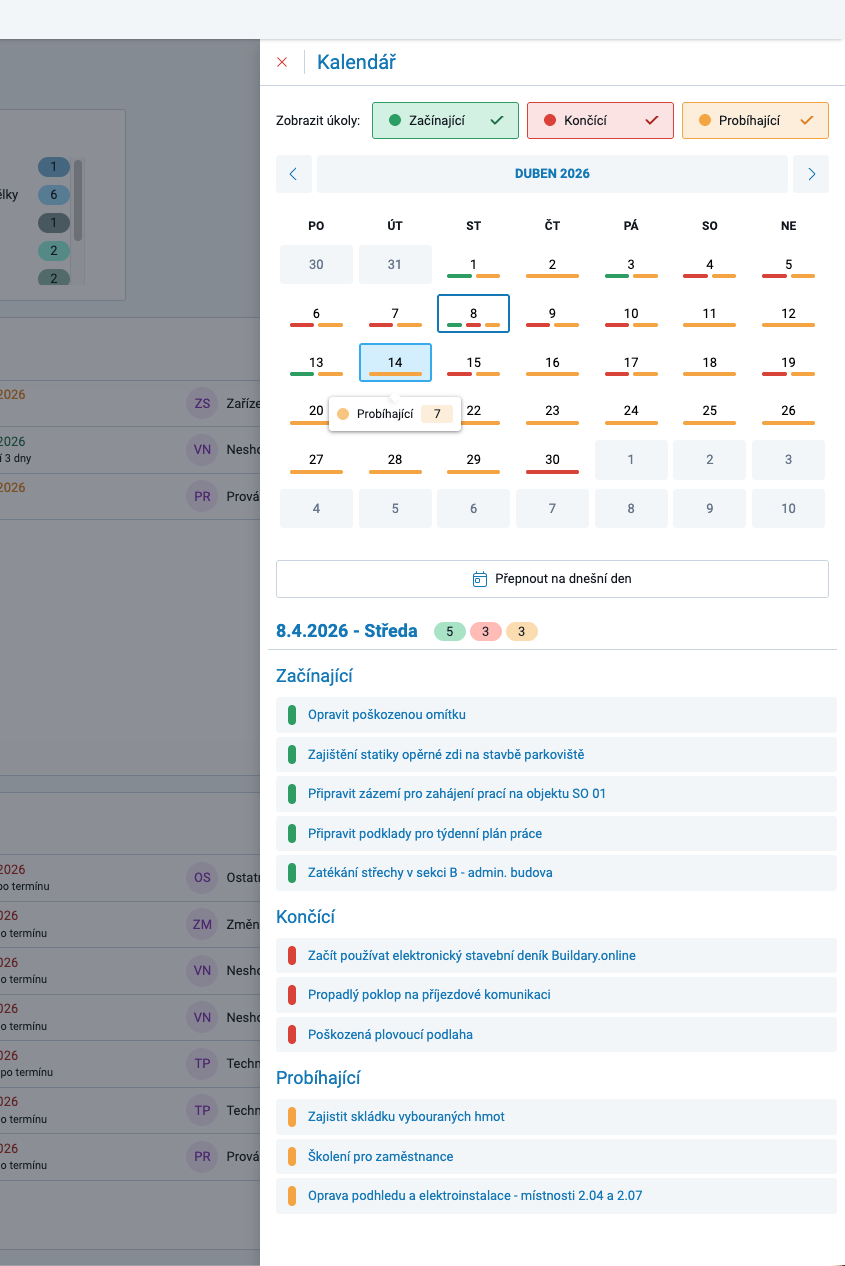
opens the calendar in the right part of the Dashboard window, showing the current month with enabled, color-coded filters for tickets that are starting / ending / in progress.
These filters can be turned on or off above the displayed month according to the required view.
Selecting a day in the calendar displays a list of that day's tickets below the calendar.
Clicking the name of a specific ticket opens the ticket for editing.
2/ Charts

The doughnut charts provide an overview of the number of tickets according to different criteria. Users can see up to 3 charts:
- The My Tickets chart ⇒ contains a summary of tickets for which the user is an assignee or approver.
- The All Tickets chart ⇒ is available only to users with permission to view all tickets.
The tickets shown in these two charts are grouped by ticket status (excluding the “Draft” status, as tickets of this type represent a non-editable template and are therefore not included in the chart).
- The Categories chart ⇒ groups the same tickets as the chart to its left, but by ticket category. In other words, a “regular” user sees their “My Tickets” in this chart, while a user with higher permissions gets an overview of all tickets grouped by category.
The charts are interactive. Clicking on a colored section of the chart representing a particular ticket type takes the user to the Ticket List page with tickets filtered according to the selected parameters. The list therefore shows exactly the tickets represented by the selected section of the chart.
3/ Task Lists by Deadline
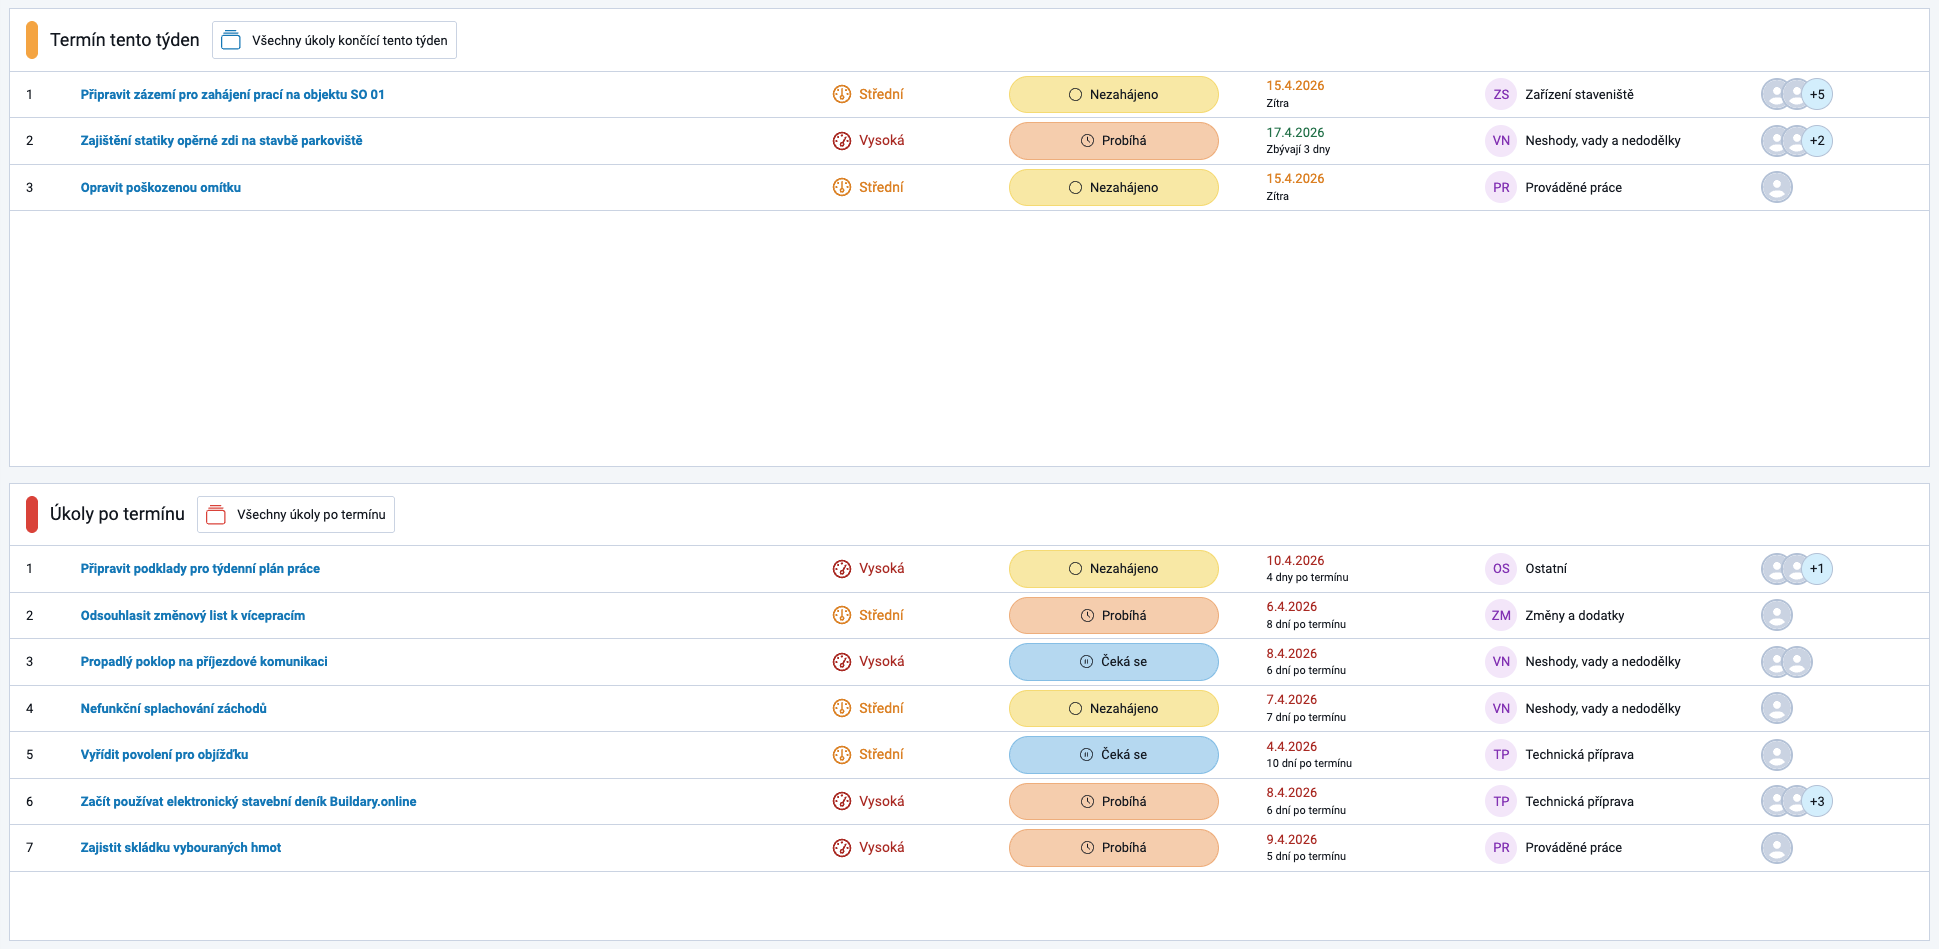
The third part of the Dashboard consists of two task lists organized by deadline:
- Due This Week ⇒ includes unfinished tickets whose scheduled end date falls within the upcoming days of the current calendar week. Depending on the user's permissions, the list displays either tickets for which the user is the assignee or approver, or all tickets.
The All Tickets Due This Week button opens the Ticket List page with a filter showing tickets for the current week from Monday to Sunday, regardless of ticket status.
- Overdue Tickets ⇒ includes unfinished tickets whose deadline has passed, again showing either tickets for which the user is the assignee or approver, or all tickets.
The All Overdue Tickets button opens the Ticket List page with a filter showing unfinished overdue tickets.
Clicking the name of a ticket opens its details.
Tickets that were due on previous days of the current week but were not completed are automatically moved to the overdue ticket list once their missed deadline has passed.